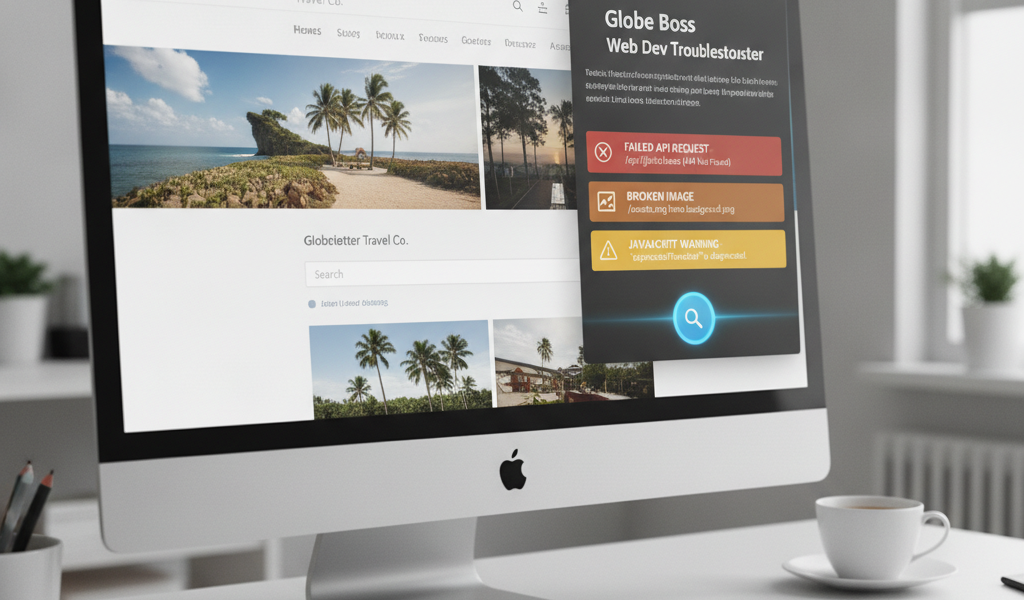
When a page looks fine at a glance, small technical problems can still be hiding underneath: a failed API request, a broken image or a JavaScript warning. Globe Boss Web Dev Troubleshooter brings common browser checks into one Chrome extension, so developers and site owners can review a live page without searching through several DevTools panels.
The extension captures JavaScript errors, promise rejections and console warnings while you browse; records failed network requests such as 404s, CORS errors, timeouts and slow requests; and flags broken images, scripts and stylesheets. Its one-click audit checks selected SEO, accessibility and security details, including missing titles, descriptions and H1s, alt text, form labels and mixed content. Findings include plain-English explanations and relevant documentation links. The free edition includes core error capture, basic audits, copy and Markdown export.
Putting it into practice
Use a scan as a repeatable debugging step: open the page, trigger the interaction that matters, then review captured errors and requests. Testing a form or menu can help reproduce intermittent problems. Export relevant findings as Markdown, include page context in your ticket, and scan again after the fix. This makes the extension a practical aid while leaving prioritisation and technical decisions with your team.
Explore the Globe Boss — Web Dev Troubleshooter product page or visit its official listing for current details.
For help choosing the right tools, email moc.ssobebolg@ofni or call +353 1 868 2345.
Related Posts
 Ensuring gdpr
compliance through a compliant cookie policy
Ensuring gdpr
compliance through a compliant cookie policy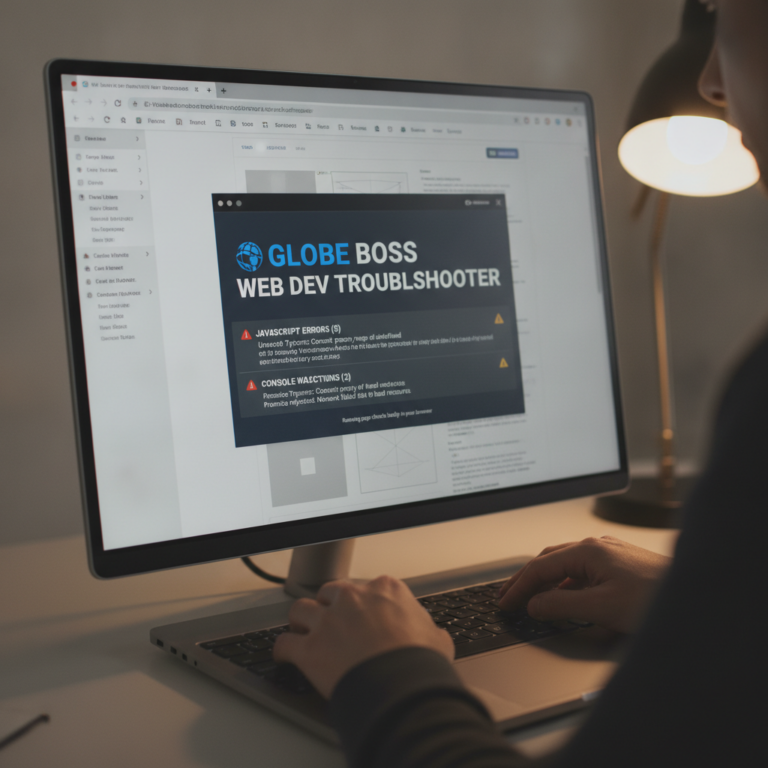 Keep Website Troubleshooting in Your Browser
 Nutritionist SEO: Grow Your Client Base Through Search
 How to Write Title Tags That Boost Click-Through Rate
 Revolution of E-commerce Through AI Search Evolution
 Is Your Irish Business Website Inside Google AI Retrieval Pipeline? Check Now
 Proven Tactics to Fix Your Irish Business Traffic Problem
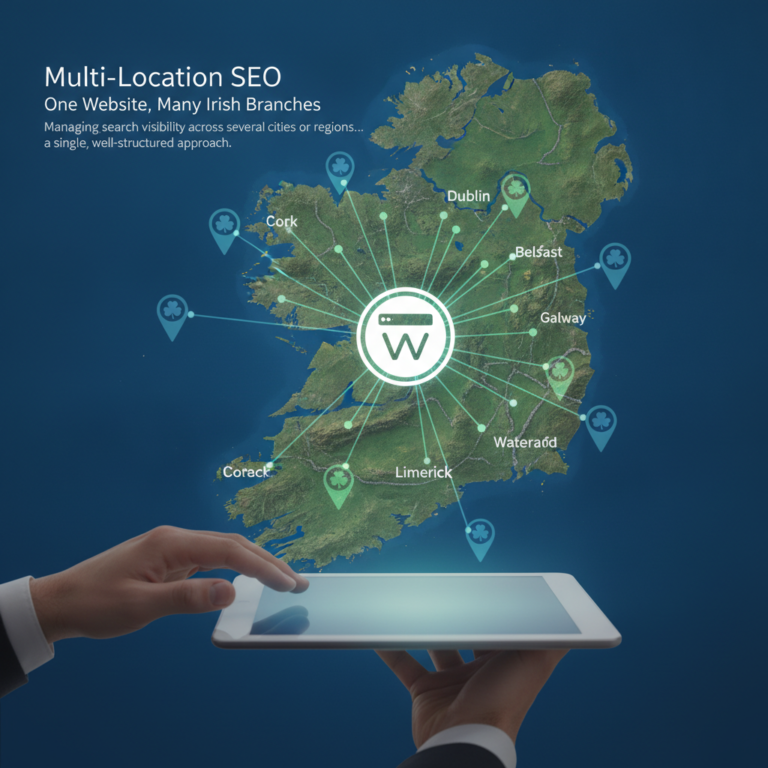 Multi-Location SEO: One Website, Many Irish Branches